


доска дуб, доска ясень, доска бук от производителя


Мы переехали, наш новый адрес: д. Пирогово, ул. Совхозная, 23 А
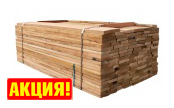
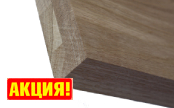
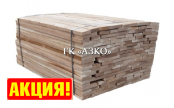
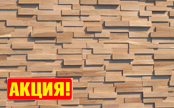
Новинки и товары по акции (обрезная сухая доска дуб, бук, ясень, ольха)
-
Новинки
 700-950 мм двойная торцовка") Новинки
Новинки 500-950 мм двойная торцовка") О наличии уточняйте по тел.39 000 руб./м3Новинки
О наличии уточняйте по тел.39 000 руб./м3Новинки 1000-1750 мм двойная торцовка") НовинкиПо акции
НовинкиПо акции 1000-1450 мм двойная торцовка")
-
По акции
 О наличии уточняйте по тел.2 429 руб./листПо акции
 О наличии уточняйте по тел.1 972 руб./листПо акции
 О наличии уточняйте по тел.3 217 руб./листПо акции
 О наличии уточняйте по тел.3 082 руб./листПо акции
 О наличии уточняйте по тел.3 858 руб./листПо акции
 О наличии уточняйте по тел.1 469 руб./листПо акции
 О наличии уточняйте по тел.1 163 руб./листПо акции
 400-650 мм двойная торцовка") НовинкиПо акции
По акции
НовинкиПо акции
По акции -1000кг ( Бигбэг )")
ГК "АЗКО" - Продажа сухой обрезной доски из дуба, бука и ясеня, мебельного щита
Группа Компаний «АЗКО» была образована в результате совместной деятельности и объединения усилий и возможностей фирм Москвы и Краснодарского Края. К основным видам деятельности Группы Компаний «АЗКО» относятся: переработке твердолиственных пород древесины (дуба, бука и ясеня) юга России; заготовка и сушка; распиловка; переработка сухой доски в ЧМЗ; сортировка и складирование готовой продукции.
Обладая собственными производственными мощностями и тесными партнерскими связями с поставщиками сырья, «АЗКО» обеспечивает полный цикл производства – от лесозаготовки до выпуска готовых изделий. Это позволяет контролировать качество на каждом этапе, гарантируя соответствие продукции самым высоким стандартам.
Стратегия компании направлена на постоянное развитие и модернизацию производственных процессов, внедрение передовых технологий и расширение ассортимента. «АЗКО» стремится удовлетворить потребности самых взыскательных клиентов, предлагая широкий выбор пиломатериалов, погонажных изделий и других продуктов деревообработки. Компания активно осваивает новые рынки сбыта, укрепляя свои позиции как надежного и перспективного партнера.